 |
| Figure 1. Four power rail signals on a single grid, with cursors measuring the time delay between the first pair in the sequence. |
Power rail sequence verification is a straightforward test. Connect the oscilloscope probes to each supply rail with the device under test powered off. Set the oscilloscope to trigger on the primary supply, with all traces overlapping on a single grid. The number of rails in your system and the length of time it takes for the sequence to complete determines the number of channels and memory length required, since every rail in a dependent sequence should be probed in a single acquisition. Our 8-channel, 5 Gpts WaveRunner 8000HD oscilloscopes are ideal for this task.
Figure 1 shows an acquisition made on an embedded system with 5 V, 3.3 V, 13 V and -12 V power rails. Triggering in this case was referenced to the -12 V bus, which was the last to come on. Note that in Figure 1, the traces have been displayed on the same grid to clearly show the sequence, with offset added to the Z1(C1) trace so that it overlaps the others. The “on” time for each trace is the point at which it reaches its minimum effective voltage. For C1, that occurs around 10 ms.
What is expected is that the voltage levels should rise or fall monotonically in the desired order at the desired time intervals. In this example, the 13 V rail (magenta trace) turns on before the others, followed by the 5 V rail (green trace), then the 3.3 V rail (blue trace) and finally the -12 V rail (yellow trace). The time delay between each power rail coming on is measured with cursors. Figure 1 shows the delay between the first pair of 13 V and 5 V buses measured at 5.18 ms. Measuring the delta from the previous rails is repeated for each rail in sequence.
 |
| Figure 2: The Dtime@level parameter automatically measures the delay between the 13 V rail (Z2) and the -12 V rail (Z1). |
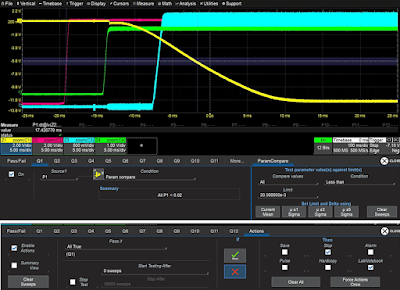
The Pass/Fail setup begins with setting up the parameters that will used as the basis for comparison. For this test, configure a parameter using delta time at level (Dtime@level), which measures the time difference between two traces at a selected voltage threshold and slope. The last measurement on traces Z1 and Z2 is 17.4 ms, shown in the Measure table under P1 (click on the image to expand it).
 |
| Figure 3: Composite screen showing the setup of a Parameter Compare Pass/Fail test. |
Watch William Kaunds explain many facets of debugging embedded systems in the on-demand webinar, Debugging Complex Embedded Computing System Issues (Part 2).
Also see:
Debugging Complex Embedded Systems
No comments:
Post a Comment