 |
| Figure 1: Use your oscilloscope's full vertical range to take full advantage of the ADC's resolution |
Figure 1 provides an example of how a pulsed waveform should appear on an oscilloscope's display. When the pulse's full amplitude fills the screen from top to bottom in this fashion, you're getting the most of the available 256 quantization values when using an 8-bit oscilloscope, or the 4096 quantization levels you get from a 12-bit oscilloscope such as Teledyne LeCroy's HDO6000 and HDO8000 series.
 |
| Figure 2: Using only half of the display's vertical range will give you only half of the ADC's vertical quantization range |
With only a quarter of the vertical scale in use, the resolution scenario is even more dire. On an 8-bit oscilloscope, you'll now have just 64 quantization levels, or 1024 levels on a 12-bit instrument.
All of this boils down to the fact that what we see on our display isn't just about the visualization of the signal, but rather it reflects what the ADC sees. The key, again, is that no matter what oscilloscope we're using, we want to maximize the display usage so as to not only see the signal better, but to obtain the most accurate characterizations.
 |
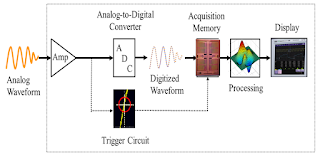
| Figure 3: A simplified block diagram of a digital oscilloscope |
It's important, then, to set the sampling rate to get enough sample points on the rising edge of an ESD pulse. It's also critical to select the volts/div setting that maximizes the oscilloscope's dynamic range. Getting both of these parameters right makes a big difference in obtaining accurate ESD characterizations.
No comments:
Post a Comment