 |
Figure 1: Examples of a Hamming
function (blue) and Hanning function
(red) |
When performing a fast Fourier transform on an acquired waveform, you'll often encounter situations where the waveform doesn't sit neatly within the oscilloscope's acquisition window so that the voltage is the same at the window's beginning and end. The ensuing discontinuity from window to window results in high-frequency artifacts, and the way to address this issue is a technique known as "windowing."
That brings up another issue, which is that there's a large number of windowing functions to choose from. They all differ in terms of the resolution that results and how much high-frequency leakage or contamination occurs from one frequency component to another. Which one should we use in FFTs?
 |
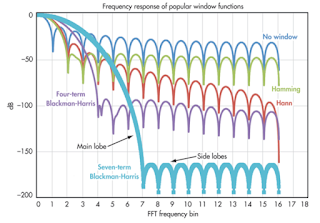
Figure 2: Shown are the frequency response curves
of some popular windowing functions |
Figure 1 shows example of a Hamming windowing function (blue) and a Hanning windowing function (red). These are two of the most widely-used windowing functions. The former is named after Richard Hamming, an engineer from Bell Laboratories who also worked on the Manhattan Project and once shared an office with Claude Shannon. The latter, though named for Julius von Hann, a father of modern meteorology, was invented by R.B. Blackman and John Tukey. It should be called the von Hann
window and is sometimes termed the Hann window, but because Hamming sounds like a verb, Hann’s
window was turned into a verb as well in the form of “Hanning.”
 |
| Figure 3: Shown is a example of an FFT in progress |
Figure 2 depicts the frequency response of several popular windowing functions. At top (blue) is what it looks like with no window, and just below that (green) is the plot for the Hamming function. Then comes the plot for the Hanning (von Hann) window. Unless there's a strongly compelling reason otherwise, the Hanning window presents the best balance of good resolution and low high-frequency leakage. If nothing else, it's a good place to start with one's FFT explorations.
Let's look at an example of an FFT in progress (Figure 3). In this example, we're looking at an acquisition window of 10 ms and we can expect a resolution, or bin size, of 100 Hz. The actual window size after
data truncation is smaller and the actual bin size is larger. We acquired about 2.5 Mpoints but, after truncation, we're using about 2.1 Mpoints.
 |
Figure 4: Shown are the calculations required to convert
units of dBm into voltage |
We discussed the elements of the horizontal scale in a
previous post, but let's consider the vertical scale for a moment. The vertical division can sometimes be confusing, because it's in units of dBm. But we care about voltage, so we have to convert dBm into the voltage.
We calculate the power as what the voltage would generate across a 50-Ω resistor (Figure 4, topmost equation). This would give us milliwatts, so we multiply it by 1000 to get watts. The power in dBm is calculated using the equation at bottom in Figure 4. Generally, the vertical scale will be displayed in dB in one form or another.
In upcoming posts, we'll begin looking at some examples of FFTs using the oscilloscope in more or less automated modes of operation.
Previous posts in this series:
Getting From the Time Domain to the Frequency Domain
About Data Truncation in Fast Fourier Transforms


No comments:
Post a Comment