 |
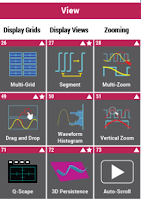
| Figure 1: The View tools arrange acquisition data to suit given needs |
Our Periodic Table groups oscilloscope tools into six categories of Capture, View, Measure, Math, Analyze, and Document. The View tools allow you to organize your acquired data in a way that leads to intuitive understanding of complex relationships among many acquired signals, measurements, Math traces, and other analytics.
The Second Step: View
Assuming you've acquired your signal(s) of interest on your Teledyne LeCroy oscilloscope, now you'll want to bring the View tools into play so that you can see the waveforms in the way that is most convenient and/or instructive for your purposes. We break down the View tools into three subcategories of a) Display Grids, b) Display Views, and c) Zooming (Figure 1).
We'll describe each of the View tools in turn, beginning with the Display Grids group:
- Multi-Grid displays enable multiple full-resolution vertical grids in one oscilloscope display. This maximizes the oscilloscope's (vertical) dynamic range and optimizes the signal fidelity of the acquired waveform because the maximum resolution of the oscilloscope ADC is being used for the vertical digitization.
- Drag-and-drop integrates with the touch screen interface so it's easy to set up your waveform display exactly the way you want Drag-and-drop is especially helpful in organizing Multi-Grid displays, but it also aids in copying setups, channels, math functions, measurements, and more; changing sources for a measurement parameter or math function; or assigning cursors to a small zoom trace in a long acquisition. Traces or measurements can be turned off with one flick, and zooming is optimized with drag to location and pinch to zoom.
- Q-Scape effectively quadruples the display area on the oscilloscope using a tabbed display with four tabs that may each be configured with a unique combination of single or Multi-Grid display grids. Tabs may be displayed one at a time (Q-Scape Single), two at a time side-by-side (Q-Scape Dual), or all at once (Q-Scape Mosaic). A user can toggle back and forth between Q-Scape and "Normal" display mode and retain display settings in each mode. Q-Scape is especially useful when performing extensive math analysis or displaying many waveforms at one time since the display "work area" can be separated into tabs for a more intuitive view of waveforms, zooms and analysis activity.
The Display Views group provides means of viewing acquisitions more meaningfully:
- Sequence-mode acquisitions capture multiple Segments with multiple triggers, but store all of the segments in one acquisition memory with no dead-time between Segments. The segments may then be displayed in a variety of display views, with or without time stamps, to further understanding.
- Waveform (or Persistence) Histogram permits creation and display of a mathematical Histogram drawn from a vertical or horizontal slice of an oscilloscope display's persistence map. This can simplify and enhance understanding of, for example, a simple persisted rising edge display of jitter or the overshoot of an amplifier signal. Teledyne LeCroy's Waveform (Persistence) Histogram can be further post-processed with Histogram parameters, and displayed in any desired location.
- Persistence is the process by which digitally acquired waveforms are processed and displayed in a way that emulates the phosphor decay appearance of an analog oscilloscope. Teledyne LeCroy's 3D Persistence view of acquired waveforms enables adjustment of the X and Y-axis of rotation, selection of color or monochrome views, and selection of a solid, shaded, or wireframe display. 3D Persistence is ideal when monitoring recurring signal behaviors for error events or visually examining waveforms for patterns of behavior.
Lastly, the Zooming group of tools gives you a closer look at acquisitions:
- Multi-Zoom capability creates Zoom traces of all channels. All zoom traces are time-synchronized by default. If desired, the time-synchronization may be disabled; or disabled, changed, and re-enabled to perform complex, repetitive analysis, e.g. failure analysis on rotating media. Multi-Zoom links well to Sequence Mode acquisitions for quickly zooming to one (or more) particular Segment displays. Up to 12 levels of zooms within zooms are supported in some oscilloscopes.
- Vertical Zoom permits zooming in the vertical (amplitude) axis independent of zoom in the horizontal (time) axis. Common applications for vertical zoom include noise analysis and correlation to causal signals, amplifier analysis, signal or power integrity studies, and loss analysis of power semiconductor devices. When combined with a 12-bit oscilloscope, Vertical Zoom provides an excellent alternative to offsetting a signal off-screen and overdriving the oscilloscope front-end to achieve wider dynamic range and high resolution on a signal. Teledyne LeCroy offers Vertical Zoom standard on most oscilloscope models.
- Auto-Scroll plays back zoom waveforms, automating visual review of long acquisitions and reducing fatigue from rotating the zoom position knob. Auto-Scroll includes pause, play (both directions), and fast-forward/rewind.
The next installment in our review of the Periodic Table of Oscilloscope Tools will cover the Measure section of the table.
No comments:
Post a Comment