 |
| Figure 1: Error-vector magnitude defined |
The performance of an OMA is very tightly coupled with the system bandwidth and the sampling rate, and this is true for both real-time and equivalent-time OMAs. The bandwidth must be significantly higher than the heterodyne signal (the source under test's spectrum plus carrier offset). If it isn't, the rise and fall times may be off and transitions between symbols may also be inaccurate.
Moreover, the sampling rate for a real-time oscilloscope in an OMA must be above Nyquist of the heterodyne signal. In practical terms, this means that a 12-GHz signal should be sampled at no less than 24 Gsamples/s.
It is also important to consider that the frequency content of the heterodyne signal may vary based on the coding of the baseband signal. For On/Off Keying (OOK) signals, Return to Zero coding formats require twice as much analog bandwidth. This is because the frequency content is shifted more toward the high end of the spectrum than for a non-return to zero (NRZ) signal. So for example, a QPSK signal with a 25-Gbaud symbol rate requires at least 50 GHz of analog bandwidth.
The differences in performance between OMA configurations becomes more apparent in context of what you hope to achieve in its use. First, let's understand the distinctions between three levels of understanding of a signal:
- Detection: I can see something going on but have no means of understanding more.
- Measurement: I can quantify, whether with a vector or scalar quantity, how big an event is.
- Characterization: I have the ability to understand an event's spatial distribution and its behavior in multiple dimensions.
Just because you can detect something doesn't mean you can measure it. And just because you can measure one parameter doesn't mean you have characterized it.
Let's look at this from the perspective of a common and simple performance metric for signals using complex modulation: error-vector magnitude (EVM), defined as a percentage of magnitude (Figure 1). A signal's EVM is simply an indication of how far the observed symbol is from the ideal symbol position.
 |
| Figure 2: Frequency range of a 32-Gbaud signal vs. frequency response of coherent optical receivers |
In a transceiver, the electrical signals are spectrally shaped using a DSP filter—typically a root raised cosine filter—to reduce the transmitter's bandwidth requirements. Such a filter derates the bandwidth requirement by about 70%. So, practically speaking, you'll need an oscilloscope with a bandwidth of 23 GHz or more for that 32-Gbaud signal. For a 56-Gbaud signal, the oscilloscope bandwidth must be 40 GHz or higher. And this is if we only want to measure the EVM, which may, or may not, tell us the whole story about our signal.
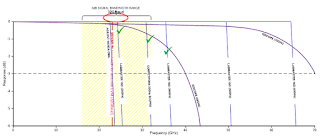
Let's look at a graph of the frequency range of our 32-Gbaud signal (Figure 2). The purple curves with decaying slopes represent the frequency response of two Teledyne LeCroy coherent optical receivers, the IQS42, a 42-GHz model, and the IQS70, which ranges to 70 GHz. From the curves, we can see that the 42-GHz receiver more than covers the required bandwidth for the 32-Gbaud signal, which is shown by the yellow-shaded area representing the 3dB bandwidth range.
 |
| Figure 3: Frequency range of a 56-Gbaud signal vs. frequency response of coherent optical receivers |
The red line on the graph shows the 23-GHz 3dB point, which is the minimum bandwidth required to measure EVM on a 32-Gbaud signal. As it stands today, there are commercial systems available for this task, such as Teledyne LeCroy's LabMaster 10 Zi-A oscilloscopes, as well as competitive instruments with sufficient bandwidth.
For a 56-Gbaud signal, the landscape shifts significantly (Figure 3). The pink-shaded area shows us the 3dB signal bandwidth range, with the red line at 40 GHz representing the minimum bandwidth threshold for EVM measurement. Figure 3 shows us that the number of available oscilloscopes that can meet this requirement are few, and the number of coherent optical receivers is fewer yet.
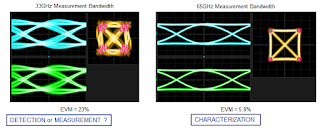
If we wish to go beyond EVM and look at the eye diagrams and constellation diagrams of a 56-Gbaud QPSK signal with a bandwidth of 40 GHz, we can discern the difference between detection or even measurement of a signal abnormality and true characterization of the signal (Figure 4, left). Were one to use an oscilloscope with 33-GHz bandwidth for this application, we would surely note distortion in the eye diagram and would see an EVM measurement as high as 23%. The scattering of the symbols indicates the system's compromised ability to accurately measure the signal.
 |
| Figure 4: Visualizing a 56-Gbaud QPSK signal with insufficient bandwidth (left) and sufficient bandwidth (right) |
Viewing the same signal on an oscilloscope with a 65-GHz bandwidth changes things considerably (Figure 4, right). No longer are the eye diagrams distorted, nor is the constellation diagram. We can see fairly focused symbol hits and consistent transitions between symbols. Note that the EVM measurement is now just 5.8%, which in and of itself tells us that we have a much cleaner signal than the 33-MHz oscilloscope's bandwidth would have us believe.
Thus, it is a legitimate question to ask whether the left side of Figure 4 represents detection or measurement? Meanwhile, the results from the 65-GHz oscilloscope clearly reveal that our 56-Gbaud signal source is very clean. Bandwidth matters!
No comments:
Post a Comment