 |
| Figure 1: Debugging of I2C on a Teledyne LeCroy WaveSurfer 3000 oscilloscope |
Anything beyond the absolutely simplest embedded systems will need to communicate with the outside world, and that is most typically done using synchronous serial-communication protocols. Three common examples of such protocols are I2C, SPI, and UART. Today's digital oscilloscopes are well up to the task of debugging serial links. Let's take a look at each of these protocols in turn and how an oscilloscope can ease the task. In this case, we'll be looking at screen captures of an I2C waveform from a Teledyne LeCroy WaveSurfer 3000 oscilloscope (Figure 1).
The Inter-Integrated Circuit (I2C) Protocol
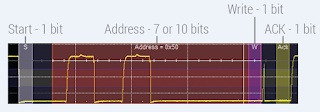
 |
| Figure 2: The breakdown of a basic I2C packet |
Now is as good a time as any to mention the utility of color-coded overlays in an oscilloscope's trigger/decode software. Color coding of the data stream makes for a much more informative and intuitive display. Depending on the timebase and the amount of zoom that's applied, the decoded stream is expanded or condensed for improved understanding of events during long or short acquisitions.
The I2C trigger decode software provides a wide range of triggering capabilities that enable quick location and isolation of events on the bus. There are simple triggers such as Start, Stop, No Ack, or Restart as well as more advanced triggering. Conditional data triggering allows selection of a range of data values to trigger on and not just a single value. Examples include less than, greater than, in range, and out of range.
Just below the graticule in Figure 1 is a table display that summarizes protocol information. The table allows you to use the oscilloscope like a protocol analyzer; the table can be custom configured to display the desired data and export it to an Excel file if you like. Touching an entry in the table automatically opens a zoom view of that portion of the acquisition. The table never obscures the view of the waveform.
In the Address Setup section of the I2C trigger/decode dialog box (Figure 1 again), you can configure an address trigger in binary or hex and in either 7- or 10-bit formats. You can also decide to include or exclude the read/write bit in the address depending on how your I2C bus operates.
The Data Pattern Setup section of the dialog box exemplifies the power of modern decode/trigger software. Here, you can set up the oscilloscope to trigger on Address + Data, or only on Data; data patterns may be entered in binary or hex. Binary triggering offers triggering on individual bits while hex triggering simplifies the setup of long data pattern triggers (up to 12-byte patterns are supported).
In the next post, we'll look more closely at the Serial Peripheral Interface (SPI) protocol.
No comments:
Post a Comment