You need to test, we're here to help.

You need to test, we're here to help.

14 December 2017

Probing Techniques and Tradeoffs (Part V): Probe Loading

Figure 1: A probe's impedance varies with frequency
Figure 1: A probe's impedance varies
with frequency
Earlier in this series of posts, we alluded to the topic of probe loading, which is an outcome of the fact that to make a measurement, an oscilloscope probe must "steal" some energy from the circuit or device under test. Thus, the probe's tip must have a finite impedance across the frequency range of interest.

06 December 2017

Probing Techniques and Tradeoffs (Part IV)

Applying bandwidth filters to a 2.5-GHz clock signal clearly shows the effect of bandwidth on rise time
Figure 1: Applying bandwidth filters to a 2.5-GHz clock
signal clearly shows the effect of bandwidth on rise time
The topic of probe bandwidth is a broad and deep one. We began our discussion of bandwidth in an earlier post with some basic information about what bandwidth means and the importance of the -3 dB point. Next, we looked at a Fourier deconstruction of a square wave into its fundamental and the lower-order harmonics, and covered the importance of bandwidth in capturing enough harmonic content to understand the signal's overall shape.

27 November 2017

Probing Techniques and Tradeoffs (Part III)

Bandwidth is defined as the frequency at which the ratio of the displayed amplitude to the input amplitude is -3 dB (or 0.707)
Figure 1: Bandwidth is defined as the frequency at which
the ratio of the displayed amplitude to the input amplitude
is -3 dB (or 0.707)
Any discussion of oscilloscopes and/or probes must include the topic of analog bandwidth. Bandwidth is one of a short list of key specifications for a testbench setup. All oscilloscopes and probes come to market with a bandwidth specification, which is defined as:

The frequency at which the ratio of the displayed amplitude to the input amplitude is -3 dB (or 0.707).

This is known as the "-3 dB point," or the half-power point (Figure 1). At this frequency, a sine-wave input signal is attenuated to 70.7% of its true amplitude. Any higher frequencies will likely be distorted on the display, making accurate measurements and calibration impossible.

20 November 2017

Probing Techniques and Tradeoffs (Part II)

A snapshot of available probes from Teledyne LeCroy
Figure 1: A snapshot of available probes from
Teledyne LeCroy
Our first post in this series concentrated on connectivity and various means by which one might apply an oscilloscope probe to a circuit or device under test. Now, we'll look at an "ideal" probe vs. a real-world probe, and then begin a discussion of probe specifications.

15 November 2017

Probing Techniques and Tradeoffs (Part I)

Probes are the signal's gateway to the oscilloscope
Figure 1: Probes are the signal's gateway to the oscilloscope
As any oscilloscope user (hopefully) knows, probing is perhaps the most critical element of getting good measurement results (Figure 1). We must understand our probes' specifications to ensure that we obtain the best possible signal fidelity, and thereby accurately characterize our signal under test. In this series of posts, we'll take you through probing tradeoffs and techniques and help you choose the right probe for the task at hand.

30 October 2017

The Power Integrity Measurement Mindset

power integrity measurement logic wheel
Figure 1:  The holistic view
of power integrity
In kicking off a series of posts on power integrity measurements, it might be helpful to start with some thoughts on the mindset, or approach, that one should take in the endeavor. Power integrity is best approached holistically, with an eye toward each of the paths energy may take throughout a system.

24 October 2017

Automotive Ethernet Compliance: Test Equipment Requirements

The TF-ENET-B Ethernet test fixture offers all necessary interconnects for compliance test
Figure 1: The TF-ENET-B Ethernet
test fixture offers all necessary
interconnects for compliance test
Having completed an exhaustive tour of the Automotive Ethernet compliance tests, we would be remiss if we didn't offer our take on the test equipment required for the job. Let's look at what the needs would be in terms of the oscilloscope itself as well as the necessary ancillary equipment, test fixture, probes, and cables. We'll conclude with a short discussion of automated compliance software.

17 October 2017

Automotive Ethernet Compliance: Tests in Detail (Part IV)

The specified pass/fail mask for the  transmitter power spectral density test
Figure 1: The specified pass/fail mask for the
transmitter power spectral density test
We've been making our way through a detailed accounting of the compliance tests for Automotive Ethernet, and in our last post, we covered the distortion test. Now we'll wrap up the tour of the compliance test suite with the test of transmitter power spectral density.

12 October 2017

Automotive Ethernet Compliance: Tests in Detail (Part III)

This depicts the setup for the Automotive Ethernet transmitter distortion test
Figure 1: This depicts the setup for the Automotive
Ethernet transmitter distortion test
Among the compliance tests specified for Automotive Ethernet in the 100Base-T1 spec, none is more complex to set up than the test for transmitter distortion. As with the transmitter timing slave jitter test described in an earlier post, it requires access to the DUT's transmit clock (TX_TCLK).

19 September 2017

Automotive Ethernet Compliance: Tests in Detail (Part II)

Figure 1: Testing transmitter timing master jitter entails creating a track of TIE measurements
Figure 1: Testing transmitter timing master jitter
entails creating a track of TIE measurements
We've begun our deep dive into the subject of Automotive Ethernet compliance testing. In our last post, we covered the first two of seven tests: maximum transmitter output droop and transmitter clock frequency. Let's now look at transmitter timing jitter in master and slave modes.

13 September 2017

Automotive Ethernet Compliance: Tests in Detail (Part I)

Maximum transmitter output droop should not exceed the specified maximum of 45%
Figure 1: Maximum transmitter output droop should not
exceed the specified maximum of 45%
We've looked in past posts at the basics of Automotive Ethernet compliance test, the five test modes, and an overview of the test setup. Now it's time to begin examining the physical-layer electrical tests in detail. As we've mentioned, there are a total of seven of these tests (six for BroadR-Reach and 100Base-T1 and one for the latter only).

08 September 2017

Automotive Ethernet Compliance: Test Setup Overview

Typical test setup for Automotive Ethernet PMA compliance test
Figure 1: Typical test setup for Automotive Ethernet
PMA compliance test
Our last post, an overview of the five test modes for Automotive Ethernet electrical compliance testing, prepared us for a deeper look at the compliance tests themselves. But before diving into details on the differential electrical compliance tests for Automotive Ethernet, be it BroadR-Reach or 100Base-T1, it might be helpful to take a look at the setup for this endeavor.

30 August 2017

Automotive Ethernet Compliance: The Five Test Modes

Automotive Ethernet electrical compliance test is defined at the connector of the transmitter
Figure 1:Automotive Ethernet electrical compliance test
is defined at the connector of the transmitter
Following up on our introduction to Automotive Ethernet compliance testing, let's move on to an overview of the five test modes that comprise the compliance test suite for the 100Base-T1 protocol. The test modes allow for a common pattern to test stressful conditions across all devices. Testing in this fashion offers the best possible odds for achieving true interoperability.

24 August 2017

Introduction to Automotive Ethernet Compliance Testing

As with most any networking scheme, Automotive Ethernet is subject to standardization to ensure that the various components of a given system reliably pass signals among themselves. Where there is a standard for a protocol, there must also be testing for compliance with that standard. This will be the first in a series of posts detailing compliance test of the Physical Media Attachment (PMA) aspect of the Automotive Ethernet standard.

17 August 2017

Back to Basics: Metrology

Some sciences are more obscure than others; these may be of interest and importance to relatively few. The term “metrology” may leave even some science geeks scratching their heads, but for those in the test and measurement arena, metrology is an extremely critical area of scientific endeavor.

27 July 2017

The Periodic Table of Oscilloscope Tools: Document

Teledyne LeCroy's Document toolset for its oscilloscopes
Oscilloscope users can find themselves managing a lot of detail in the course of driving their instruments. They need to keep track of instrument setups. They have to know standards-based compliance test routines backward and forward. Often, the need arises to remotely control the oscilloscope, interface it with other applications, and export/import acquisition data. And, importantly, the oscilloscope has to aid, and not hinder, collaboration with other members of the engineering team(s).

And thus we arrive at the end of our survey of the Periodic Table of Oscilloscope Tools with the Document portion.
  • Hardcopy: Use the oscilloscope's Print button to pre-define a documentation action and execute that action with the press of one button. Select to create a file of a screen image in a variety of formats; send an email with an attached screen image; copy data to a clipboard; print a document; or save the waveform data, screen images, panel setups, and the end user's annotations as a LabNotebook (see below).

26 July 2017

The Periodic Table of Oscilloscope Tools: Analyze (Part III)

Periodic Table
We're nearing the end of our tour of the Periodic Table of Oscilloscope Tools, our way of presenting our broad palette of oscilloscope tools in a concise, clear fashion. In this installment, we'll finish up the Analyze grouping, by far the largest on the Periodic Table.

20 July 2017

The Periodic Table of Oscilloscope Tools: Analyze (Part II)

The Analysis tools in an oscilloscope lend it debug power
Figure 1: The Analysis
tools in an oscilloscope
lend it debug power
Oscilloscopes are central to many engineering tasks, but perhaps to none more so than debugging. Something is going on with your design but you don't know what it is. However, armed with an oscilloscope with the sort of sophisticated analysis tools found in Teledyne LeCroy's instruments, even Mr. Jones can get to the bottom of the problem. Let's continue our survey of the Periodic Table of Oscilloscope Tools with more on analysis tools.

18 July 2017

The Periodic Table of Oscilloscope Tools: Analyze (Part I)
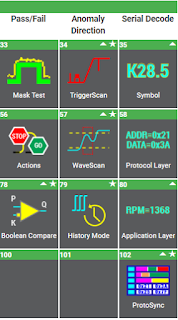
Analysis tools deepen insight into waveform behavior and relationships
Figure 1: Analysis tools deepen
insight into waveform behavior
and relationships
The path from problem to solution via oscilloscope moves through a number of stages. Doing so involves capture of a signal, determining how it's to be viewed, taking measurements of various parameters, and possibly applying math functions to the waveform. All of these stages depend on the roster of tools that the oscilloscope brings to bear on the process. Teledyne LeCroy's Periodic Table of Oscilloscope Tools represents our view of the world of such tools.

14 July 2017

The Periodic Table of Oscilloscope Tools: Math

DSP-based Math functions can reveal deep insights hidden in waveforms
Figure 1: DSP-based
Math functions can
reveal deep insights
hidden in waveforms
The usefulness of oscilloscopes skyrocketed once digital signal processing began to be applied to acquired waveforms. By applying DSP, oscilloscopes could now perform complex processing in the time, frequency, statistical, and other domains, all while imposing no restrictions on acquisition length. Here at Teledyne LeCroy, we collectively refer to these DSP-based processes as Math functions. We've presented those functions, along with all of the other functions our instruments perform, in chart form in our Periodic Table of Oscilloscope Tools.

12 July 2017

The Periodic Table of Oscilloscope Tools: Measure

Measure tools are at the heart of an oscilloscope's utility
Figure 1: Measure
tools are at the heart
of an oscilloscope's
utility
An oscilloscope is only as good as the tools it provides to users for acquiring, viewing, measuring, analyzing, and documenting waveforms. We present an overview of our deep collection of oscilloscope tools in our Periodic Table of Oscilloscope Tools, and in prior Test Happens posts, we've surveyed the Capture and View categories. Today we'll break down the Measure section of the Table.

07 July 2017

The Periodic Table of Oscilloscope Tools: View
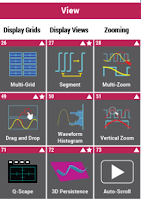
The View tools arrange acquisition data to suit given needs
Figure 1: The View tools
arrange acquisition data
to suit given needs
We began our survey of Teledyne LeCroy's Periodic Table of Oscilloscope Tools by reviewing our set of Capture tools, which help to isolate and capture signals of interest and shorten time to insight. Now we'll turn our attention to the next grouping of tools: the View tools.

05 July 2017

The Periodic Table of Oscilloscope Tools: Capture

The Periodic Table of Oscilloscope Tools is a handy reference to oscilloscopes' capabilities
Figure 1: The Periodic Table of Oscilloscope Tools
is a handy reference to oscilloscopes' capabilities
Early analog oscilloscopes were quite a breakthrough in their day. For the first time, engineers and hobbyists were afforded the ability to "see" electrical signals displayed on a CRT as a function of voltage vs. time. The advent of analog oscilloscopes meant a new way to think about, compare, and visualize signals.

29 June 2017

Distinguishing BroadR-Reach and 100Base-T1

BroadR-Reach provides full-duplex operation over a single twisted pair of wires
Figure 1: BroadR-Reach provides full-duplex operation
over a single twisted pair of wires
The world of Automotive Ethernet can be a little confusing in that there are two dominant specifications that serve the application space: BroadR-Reach and 100Base-T1. Both are explicitly intended for automotive use and there's quite a bit of overlap between them. In this installment, we'll look a little more closely at BroadR-Reach applications and also explain the differences between it and 100Base-T1.

27 June 2017

The Basics of Automotive Ethernet Testing

Automotive Ethernet PHY test requires 1-GHz bandwidth and 2-GS/s sample rate minimum
Figure 1: Automotive Ethernet
PHY test requires 1-GHz bandwidth
and 2-GS/s sample rate minimum
Now that we've discussed what Automotive Ethernet is all about, discussed its benefits, and dug deeper into BroadR-Reach, the next topic for discussion is an overview of testing for the protocol and the equipment requirements to test the physical layer.

20 June 2017

VIDEOS: Exploring MAUI with OneTouch

MAUI with OneTouch makes child's play of complex oscilloscope operations
Figure 1: MAUI with OneTouch makes
child's play of complex oscilloscope
operations
If a picture is worth a thousand words, how many words is a video worth, even if it's only 10 to 15 seconds long? If the videos in question illustrate how to use Teledyne LeCroy's MAUI with OneTouch next-generation user interface (Figure 1), their value is inestimable. Once you've seen how easy it is to use an oscilloscope with MAUI with OneTouch, you'll know it was time well spent.

19 June 2017

Why Automotive Ethernet?

The MOST infotainment protocol offers a higher aggregate bandwidth than Automotive Ethernet, but its 150-Mb/s bandwidth is shared across the network
Figure 1: The MOST infotainment protocol offers a higher
aggregate bandwidth than Automotive Ethernet, but its 150-Mb/s
bandwidth is shared across the network
In recent posts, we've been reviewing the subject of Automotive Ethernet in general and the BroadR-Reach protocol in particular. In today's installment, let's look at some of the benefits of using the protocol while comparing it to some other protocols that see usage in the automotive environment.

14 June 2017

Fundamentals of the BroadR-Reach Protocol

BroadR-Reach delivers bandwidth of 100 Mb/s
Figure 1: BroadR-Reach
delivers bandwidth of
100 Mb/s
The burgeoning complexity of vehicular networks, the resultant high bandwidth demands, and the harshness of the automotive environment have driven the development of what we know today as Automotive Ethernet. Our last post began an overview of Automotive Ethernet technology, focusing on the physical/mechanical constraints and industry trends that influenced the protocol's development. Next, let's look more closely at the BroadR-Reach protocol.

12 June 2017

Back to Basics: Automotive Ethernet

Figure 1: Automotive Ethernet handles a wealth of functionality
Figure 1: Automotive Ethernet handles
a wealth of functionality
Today's vehicles are as networked, if not more so, than our homes, offices, and factories. According to one estimate, the wiring harness for a multiplexed bus in a high-end luxury vehicle can weigh as much as 110 lbs. Hence the rise of standards for automotive networking such as Automotive Ethernet (Figure 1). Let's begin a survey of the basics of Automotive Ethernet: What is it, where did it come from, where is it going, and what are the testing requirements?

30 May 2017

An Inside Look at an Automotive Ethernet Seminar

Students gain first-hand experience in Automotive Ethernet protocol testing
Figure 1: Students gain first-hand experience in
Automotive Ethernet protocol testing
Teledyne LeCroy's Automotive Technology Center (ATC) in Farmington Hills, MI recently hosted a full-day seminar on Automotive Ethernet. Below, Bob Mart, product line manager, shares some of his thoughts on how the seminar went and provides a preview of Teledyne LeCroy's next live Automotive Ethernet day at the ATC on June 15, 2017 (detailed information on this and other automotive-related events can be found here).

19 May 2017

Testing the DDR Memory Interface's Physical Layer (Part IV)

Probes are a key element of the total signal acquisition system
Figure 1: Probes are a key element of the total signal
acquisition system
In this multipart survey of testing the DDR interface's physical layer, we've looked at the basics of the interface itself, a high-level overview of the testing, how to access DDR signals, and read/write burst separation. In this installment, we'll cover preparation for the actual testing.

24 April 2017

Testing the DDR Memory Interface's Physical Layer (Part III)

For analysis purposes. it's critical to separate read and write bursts of interest
Figure 1: For analysis purposes. it's critical to separate
read and write bursts of interest
Last time around, we began examining some of the challenges that come with testing the DDR interface's physical layer. In that post, we concentrated on getting to the devices' physical connections by various means including interposers, backside vias, and DIMM series resistors. Now, presuming we've managed to gain access to the DDR's ball-grid array, the next hurdle is separation of read and write bursts.

11 April 2017

Testing the DDR Memory Interface's Physical Layer (Part II)

A typical BGA package for DDR memory
Figure 1: Shown is a typical BGA
package for DDR memory
In the first of this series of posts, we undertook a high-level view of physical test of a DDR memory interface. Moving forward, let's look into some of the specific challenges one faces in a close examination of these interfaces.

05 April 2017

Testing the DDR Memory Interface's Physical Layer (Part I)

Clock, strobe, and data are three critical signals in DDR test
Figure 1: Clock, strobe, and data are
three critical signals in DDR test
In an earlier post, we took a brief tour through what constitutes a DDR memory interface: clock, command, address, and strobe+data lines linking a memory controller and an array of DRAM memory ICs. Next, we'll examine what DDR interface testing is all about, concentrating primarily on the physical layer.

29 March 2017

Fundamentals of the DDR Memory Interface

A representative test setup for physical-layer DDR testing
Figure 1: A representative test setup
for physical-layer DDR testing
Double data-rate (DDR) memory has ruled the roost as the main system memory in PCs for a long time. Of late, it's seeing more usage in embedded systems as well. Let's look at the fundamentals of a DDR interface and then move into physical-layer testing (Figure 1).

20 January 2017

Back to Basics: Three-Phase Sinusoidal Voltages

Three-phase AC voltages consist of three voltage vectors
Figure 1: Three-phase AC voltages
consist of three voltage vectors
In a previous post, we briefly covered the basics of single- and three-phase AC power systems. Single-phase systems, as we've noted, comprise a single voltage vector with a magnitude (in VAC) and a phase angle. Of course, a three-phase voltage consists of three voltage vectors and three phase angles. This installment will go on to describe three-phase AC voltages in similarly brief fashion.