 |
| Figure 1: Shown are some common Lissajous patterns in an X-Y display |
You need to test, we're here to help.
You need to test, we're here to help.
10 December 2015
Using Your Oscilloscope's X-Y Display
30 November 2015
Follow The Bouncing Signal
 |
| Figure 1: Trend plotting is a handy tool for discerning frequency-hopping patterns |
18 November 2015
Analyzing RADAR Signals with Demodulation
 |
| Figure 1: An example of a radar signal with 1-GHz RF carrier |
02 November 2015
Video: The Many Varieties of Oscilloscope Probes
Got a minute (OK, a minute and a half)? Take a look at this quick tutorial video that takes you through the four basic types of probes and what they're used for:
If this little thumbnail sketch whetted your appetite for more info on oscilloscope probes, we've got you covered with a series of popular blog posts on the topic:
Back to Basics: Probes (Part IV)
Understanding Probe Calibration Methods
Understanding Probe Calibration Methods (Part II)
The Effects of Passive Probe Ground Leads
Understanding Probe Calibration Methods
Understanding Probe Calibration Methods (Part II)
The Effects of Passive Probe Ground Leads
21 October 2015
Analyzing Pulse-Width Modulation Signals
 |
| Figure 1: Persistence display provides a quick-and-dirty view of a PWM signal |
14 October 2015
Determining an RF Burst's Envelope
 |
| Figure 1: Demodulation is one method of determining the envelope of an RF burst |
01 October 2015
Taking Best Advantage of Oscilloscopes' Long Memory
 |
| Figure 1: Maintaining the maximum sample rate over more timebase settings is possible with long memory |
11 September 2015
For UART Debugging, Triggering is Key
 |
| Figure 1: A typical screen capture of UART serial decode/trigger software |
03 September 2015
Shaking Bugs Out of SPI Buses
 |
| Figure 1: Debugging of SPI on a Teledyne LeCroy WaveSurfer 3000 oscilloscope |
12 August 2015
Test Challenges for PAM4 Signals
 |
| The major test challenges posed by PAM4 signals |
06 August 2015
Why High Oscilloscope Sampling Rates Matter
 |
| Figure 1: Here is an example of aliasing that results from sampling a signal at less than the Nyquist rate of 2fmax |
22 July 2015
Debugging I2C Buses in Embedded Systems
 |
| Figure 1: Debugging of I2C on a Teledyne LeCroy WaveSurfer 3000 oscilloscope |
PAM4 Test Setups Vary With Applications
15 July 2015
The Fundamentals of PAM4
 |
| PAM4 doubles the number of bits in serial data transmissions by increasing the number of levels of pulse-amplitude modulation, but does so at the cost of noise susceptibility |
08 July 2015
Using Persistence Mode and Exclusion Trigger
On a digital oscilloscope, the persistence display mode is a little like the sustain pedal on a piano. When persistence display is selected, the oscilloscope will trigger, display the signal trace, then trigger again and add another trace to the display, and so on.
25 June 2015
Don't Leave Oscilloscope Performance on the Table
 |
| Figure 1: In this screenshot, four signals are displayed on a single grid. Each signal is only using 64 counts of its ADC, which amounts to 6-bit resolution. |
16 June 2015
Device Analysis in Switch-Mode Power Supplies
 |
Figure 1: Setup for analysis of switching losses
in a switch-mode power supply's MOSFET
|
11 June 2015
Reducing Errors in Switch-Mode Power Supply Measurements
 |
Figure 1: Skew between voltage and current probes
results in power measurement errors
|
09 June 2015
Testing Techniques For Switch-Mode Power Supplies
 |
| Figure 1: A simplified schematic of a switch-mode power supply circuit |
05 June 2015
Testing Challenges in Motor Drive Systems (Part III)
 |
Figure 1: An example of PWM for
a single power semiconductor
|
28 May 2015
The History of Jitter (Part V)
 |
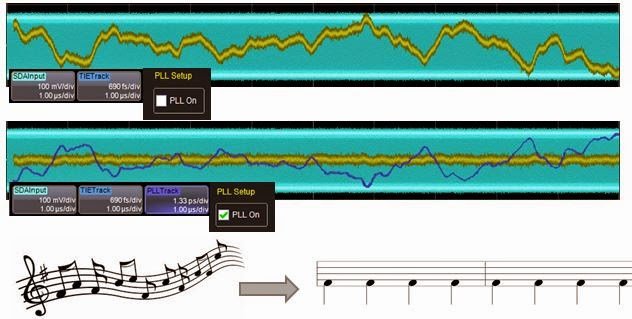
| Figure 1: Applying PLLs for clock-data recovery is not unlike tapping your feet to the beat of music |
19 May 2015
The History of Jitter (Part IV)
 |
| Figure 1: An example of a time-interval error track |
07 May 2015
Using Histograms (Part IV)
 |
Figure 1: A histogram of delay between traces C1 and C2
with an unknown event occuring 2.5 ns outside of
expected range
|
15 April 2015
Testing Challenges in Motor Drive Systems (Part II)
 |
| Figure 1: This image depicts the complete design and debug challenge posed by a variable-frequency motor drive |
07 April 2015
Testing Challenges in Motor Drive Systems
 |
| Figure 1: The power section of a motor drive system requires measurements of line input, PWM output, and efficiencies |
02 April 2015
The History of Jitter (Part III)
 |
Figure 1: Latching a signal at the outermost of the blue
hash marks results in a BER of 10-3, while latching it
at the innermost hash marks yields a BER of 10-12
|
27 March 2015
Oscilloscope Basics: Choosing an Oscilloscope
 |
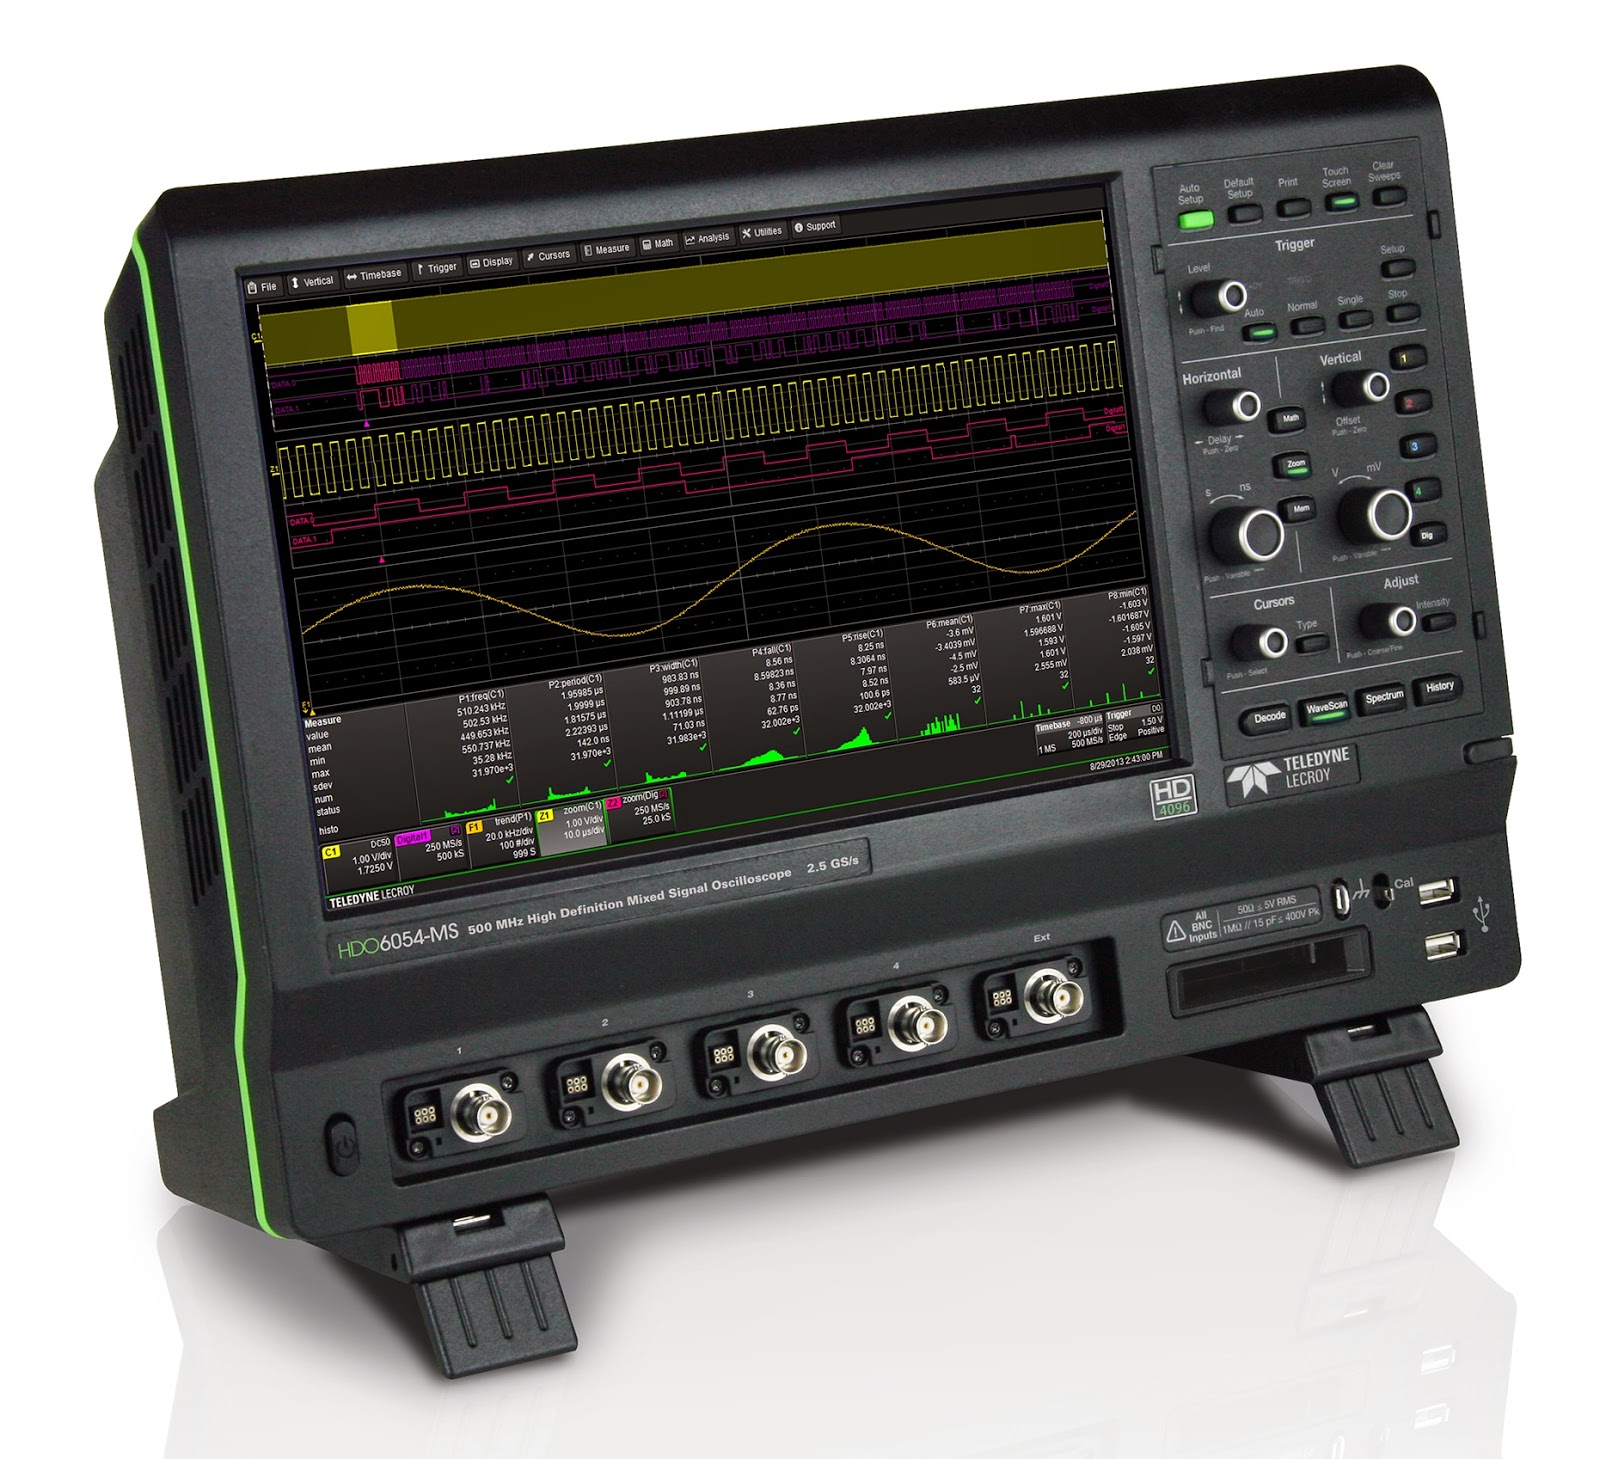
| Figure 1: An oscilloscope such as Teledyne LeCroy's HDO6054-MS serves a very broad range of applications |
20 March 2015
Using Histograms (Part III)
 |
| Figure 1: A simplified view of a push-pull amplifier showing the source of crossover distortion |
12 March 2015
The History of Jitter (Part II)
 |
| Figure 1: An example of using histograms to plot the statistical distribution of edge arrival times |
05 March 2015
The History of Jitter
 |
| Figure 1: The story of jitter spans 45-baud telegraph machines to 160-Gbaud optical fiber |
27 February 2015
Using Histograms (Part II)
 |
Figure 1: A flip-flop's propagation delay is a typical spec
that can be derived using statistical analysis
|
09 February 2015
Using Histograms (Part I)
 |
| Figure 1: Histograms of the period, width, and TIE show different distributions of time jitter |
30 January 2015
Plan For Successful USB Compliance Testing (Part III)
 |
| Figure 1: In USB 3.0 link-layer compliance test, all logical states of the LTSSM come into play |
26 January 2015
Plan For Successful USB Compliance Testing (Part II)
 |
| Figure 1: A representative transmitter compliance test setup |
16 January 2015
Plan For Successful USB Compliance Testing (Part I)
 |
| Figure 1: The coveted SuperSpeed USB logo |
Subscribe to:
Comments (Atom)

