 |
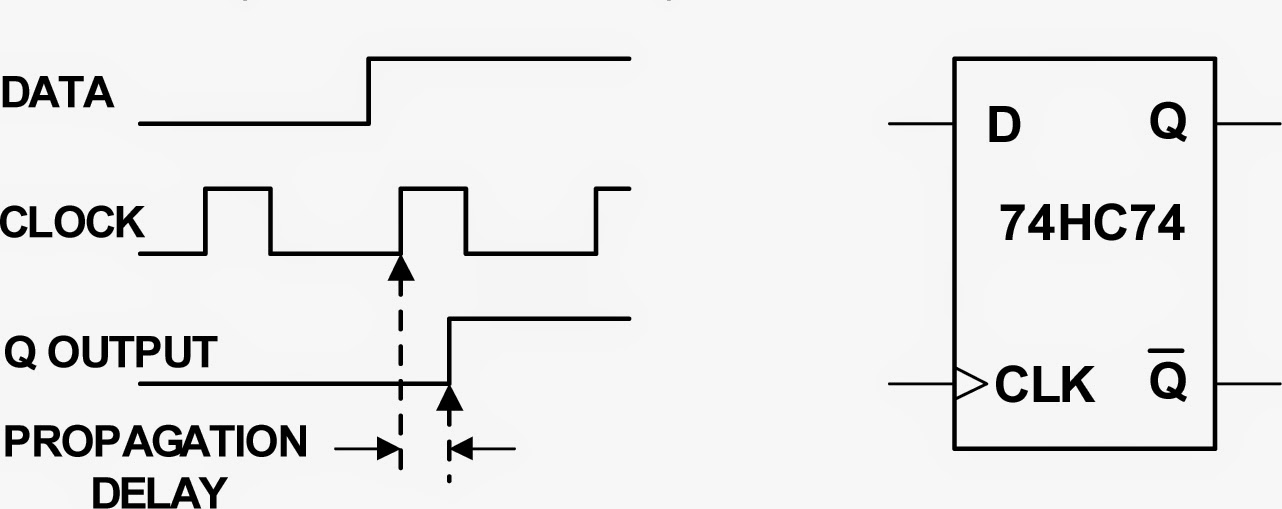
Figure 1: A flip-flop's propagation delay is a typical spec
that can be derived using statistical analysis
|
You need to test, we're here to help.
You need to test, we're here to help.
27 February 2015
Using Histograms (Part II)
09 February 2015
Using Histograms (Part I)
 |
| Figure 1: Histograms of the period, width, and TIE show different distributions of time jitter |
Subscribe to:
Comments (Atom)