You need to test, we're here to help.

You need to test, we're here to help.
Showing posts with label standard deviation. Show all posts

12 March 2015

The History of Jitter (Part II)

An example of using histograms to plot the statistical distribution of edge arrival times
Figure 1: An example of using histograms to plot
the statistical distribution of edge arrival times
Resuming our review of the history of jitter and the evolving response to it, we'd arrived at the late 1990s, when more sophisticated analysis methods were necessary to get a good handle on jitter. In particular, statistical analysis came onto the scene. Statistics are a great tool for analyzing phenomena such as jitter that change more as you look at them harder.

27 February 2015

Using Histograms (Part II)
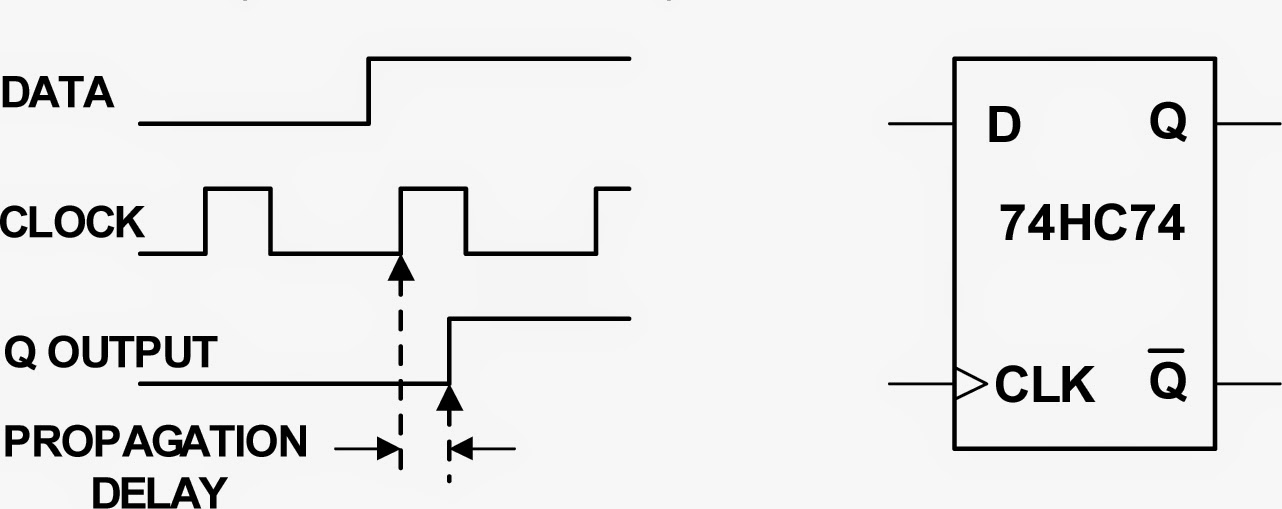
Figure 1: A flip-flop's propagation delay is a typical spec that can be derived using statistical analysis
Figure 1: A flip-flop's propagation delay is a typical spec
that can be derived using statistical analysis
In Part I of this series, we looked at some of the basics of histograms and how they can provide a statistical view into random variation of signal parameters. Next, let's look at how histograms can help us use statistical analysis to determine product specifications.