Many motorists love the experience of driving a sporty car with its convertible top down and a stickshift manual transmission. Others don't want the hassle of a clutch and prefer the user-friendly feel of a slick automatic that does some of the work for them. Oscilloscopes can provide the same sort of choice for many measurement tasks in the same instrument.
Such is the case with fast Fourier transforms (FFTs), which allow viewing, measurement, and analysis of waveforms in the frequency domain rather than in the traditional time-domain view. You can invoke the FFT math function found in just about all modern oscilloscopes with respect to any waveform, but you'll have to be prepared to turn some knobs and flip some switches to get to the critical information. That's the "manual transmission" approach to driving an oscilloscope.
Many oscilloscopes, such as Teledyne LeCroy's
WavePro HD series, can be equipped with a
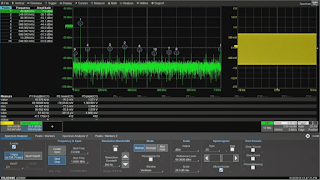
spectrum analyzer software option (Figure 1) that takes a lot of guesswork off the table for the user and that presents a user interface that's very similar to that of a dedicated spectrum analyzer.
Our last post looked at using an oscilloscope in
"stickshift" mode to perform an FFT. Now let's see how the process works while driving the instrument as an "automatic."
 |
Figure 2: The highest frequency in the spectrum
analysis will impact the oscilloscope's
sampling rate
|
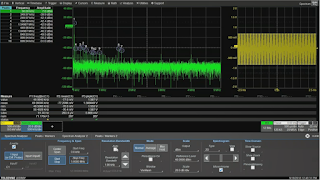
If installed in a given Teledyne LeCroy oscilloscope, the Spectrum Analyzer application can be found in the Analysis dropdown menu at the top of the display. In the screen capture of Figure 2, the spectrum width is set from zero to 1 MHz for the acquired sine wave. It's important to remember that in this automatic mode, setting the highest frequency will have an impact on the instrument's sampling rate. You always want to have a sampling rate of at least 2X the highest frequency; the software typically adheres to the 5X rule of thumb. Thus, for our frequency spectrum of 1 MHz, the oscilloscope has been automatically set for a sampling rate of 5 MS/s. If we were to change the analysis to 5 MHz full scale, we'd see the sampling rate set to 25 MS/s.
 |
Figure 3: Resolution bandwidth affects horizontal
timebase |
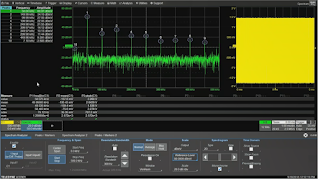
Likewise, the resolution bandwidth will affect the horizontal timebase. In Figure 1, the resolution bandwidth is set at 200 Hz. Using 1/200 Hz, we determine that we want at least 5 ms for the period of the acquisition window. Accounting for the overhead of the FFT operation, the oscilloscope automatically sets that period at 20 ms. If we want to have less resolution bandwidth, say 1 kHz, the instrument will respond by zooming out the horizontal timebase to 5 ms (Figure 3).
Thus, in the automatic mode using the Spectrum Analysis software, we control key parameters of the acquisition by setting parameters of the analysis itself. But in the manual mode of using the FFT Math function, the user has to make his/her own adjustments to the sampling rate and timebase.
Another great feature of the Spectrum Analyzer software's automatic mode is its ability to identify frequency peaks in the signal. We know that most of the interesting details of our sine wave are in the low-frequency range. To get a good look at that part of the spectrum, we'll want to decrease our resolution bandwidth, which will cause a corresponding zooming out of the horizontal timebase. We won't change the sampling rate, and the oscilloscope is smart enough to know it has to increase its acquisition rate to take in more data.
 |
Figure 4: Determining frequency peaks in the
acquired signal is simple with the
Spectrum Analyzer software option |
In the Peaks / Markers tab of the Spectrum Analyzer setup dialog, it's a simple matter to turn on the Peaks function, which will automatically indicate frequency peaks in the signal in real time (Figure 4). The peaks don't change because they're frequency components of the sine wave. We also can turn on annotations that will show us the frequencies of the individual peaks.
We have arrived at the same conclusion that we arrived at when we looked at the sine wave in the "stickshift mode," which is that it's a grossly distorted waveform being generated by a quick-and-dirty little signal generator. As in that previous example, we don't really need the frequency markers to see that our primary peaks begin at 50 kHz and repeat every 50-kHz interval thereafter.
To recap, the "automatic mode" of performing an FFT using the Spectrum Analyzer software option in the WavePro HD oscilloscope makes the process pretty bulletproof. We can control the instrument as though it's a spectrum analyzer: changing the maximum frequency controls the sampling rate, and adjusting the resolution bandwidth controls the horizontal timebase. Thus, we don't have to think about those parameters as we would in the "stickshift" manual mode.
In our next post, we'll look at a couple of other FFT examples.
Previous posts in this series:


No comments:
Post a Comment