 |
Figure 1: Trigger dialog boxes will
match the protocol of interest |
Debugging and validation of the physical layer of serial-data links is a preeminent oscilloscope application area these days. Today's real-time digital oscilloscopes have a wealth of tools to help you dig into any/all serial protocols and learn what's really going on electrically with your serial links.
First and foremost is serial triggering and decode. When appropriately equipped, Teledyne LeCroy oscilloscopes isolate events in the data stream through use of serial-data triggers and conditional data triggering. You can completely isolate specific protocol messages, and/or use conditional triggering to select a range of data values to trigger on vs. triggering on a single data value (although you can do that as well if needed). Within the instruments are FPGAs that are programmed for the protocol of interest, and the trigger dialog box will match the protocol you're using and want to trigger on (Figure 1).
 |
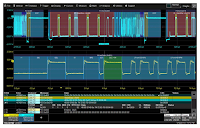
Figure 2: Color-coded overlays help
decipher the data stream |
Instead of looking at zeroes and ones, the serial-data software decodes the data stream. In doing so, it applied color-coded overlays to the decoded protocol, which makes for an easy-to-understand visual display (Figure 2). Depending on the time base or the amount of zoom applied to the waveform, the decode data is either condensed or expanded to help gain more knowledge regarding the data stream.
 |
Figure 3: Use tracks and trends to
identify trouble spots in a serial link |
Being able to trigger on, decode, and parse the serial data stream is invaluable, bringing a deep level of insight here's no way to understand, and iron out, the physical layer of a serial data link without measurements. Figure 3 depicts an example of a CANbus decode and how you can use
tracks and trends help confirm and validate that the link is functioning correctly and that specific nodes or microcontrollers are not causing issues. If issues do crop up, now you know where to begin looking for answers.
 |
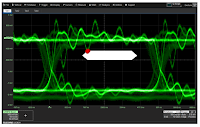
Figure 4: Pass/fail mask testing quickly
highlights areas in which the eye
closes |
Eye diagrams are a critical tool in PHY-layer analysis and in quantifying system performance. With eye diagrams, we can observe the transitions from logic-high to logic-low states and vice versa. Unless the eye opening isn't wide enough in terms of amplitude, we will have an unacceptable bit-error rate. If there's horizontal jitter, transitions won't be clean and properly timed. Pass/fail mask testing works hand in hand with eye diagrams to reveal whether specific bit patterns are causing failure. Mask failures (Figure 4) will be denoted with a red circle on the eye diagram plot. Then, you can touch a failure table to interactively open a zoom trace of the failed area to get a closer look.
 |
Figure 5: An interactive, time-interleaved table summarizes
results for up to four protocols at one time |
Beneath the waveform grids, an interactive, time-interleaved table summarizes results. The table can display time-correlated data for up to four protocols at a time (Figure 5). Touching any row in the table automatically opens a zoom trace of the waveform for that packet. The table is a highly useful tool for when you want to look into interaction between networks.
 |
Figure 6: Extract digital data from specific locations and use
the Message-to-Value measurement parameter to graph
system performance over time |
Digital data can be extracted from specific locations in the serial data message using the Message-to-Value measurement parameter: in effect, a serial-data digital-to-analog converter (DAC). That information can then be displayed as a measurement parameter value, or as a time-correlated waveform showing the measurement value over time (Figure 6). This capability, combined with the oscilloscope's long acquisition memory, helps to understand how the data might change over long periods of time and how that relates to other system behaviors. One might use this capability to view I2C or SPI temperature-sensor data, CAN wheel-speed data used by an anti-lock braking system, or DigRF 3G radio frequency I and Q modulated signals.
Previous posts in this series:
Getting The Most Out Of Your Oscilloscope: Setup
Getting The Most Out Of Your Oscilloscope: Navigation with MAUI
Getting The Most Out Of Your Oscilloscope: Trigger Delay
Getting The Most Out Of Your Oscilloscope: Documentation
Getting The Most Out Of Your Oscilloscope: Cursors and Parameters
Getting The Most Out Of Your Oscilloscope: Tracks and Trends
Getting The Most Out Of Your Oscilloscope: WaveScan and XDEV Custom Parameters
Getting The Most Out Of Your Oscilloscope: Sequence and History Modes
Getting The Most Out Of Your Oscilloscope: Math Functions


No comments:
Post a Comment