 |
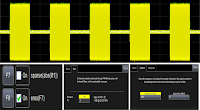
Figure 1: Demodulation is one method
of determining the envelope of an RF burst |
There aren't many wireless environments more complex than that of the electronic-warfare arena. Spread-spectrum clocking, frequency hopping, jamming, you name it: It's an RF jungle out there, and signals intended for electronic-warfare applications demand precision instrumentation and skilled hands for test and measurement purposes.
Let's take a look at how some common, yet critical, measurements can be made for these types of signals. One often-required measurement is to determine the envelope of an RF burst; we'll look at four approaches to this task.
The first example concerns an RF burst with a mean frequency of 9.75 GHz (Figure 1). We can determine the envelope of the bursts by setting up a demodulate math operator on the RF pulse and setting the carrier frequency to 9.75 GHz to measure amplitude modulation. The red trace, F6, is the demodulated carrier.
 |
Figure 2: Various measurements
may be made on demodulated RF pulses |
We can take this a step further to perform measurements on the demodulated waveform. Figure 2
shows the same pulse, but with a split grid to isolate the demodulated waveform from the RF pulses. Measuring the frequency (P7) of the zoomed area of the un-demodulated pulse confirms the frequency of 9.75 GHz. Measuring the width of the demodulated pulses using the width@lvl parameter (P3) yields a mean pulse-width value of some 998 ns, while the edge@lvl parameter (P4) gives us the number of RF pulses.
However, when we measure the frequency of the demodulated waveform (P6), we find a 500-kHz modulation, which tells us the pulse-repetition frequency (PRI), a common RF-burst measurement. We can also measure the PRI using the period parameter (P2), with which we find a PRI value of 1.999 μs. This also can be measured directly with an automatic parameter by first demodulating the RF carrier and using standard oscilloscope measurement parameters.
 |
Figure 3: A Hilbert transform in Matlab
reveals an RF burst envelope |
A second approach to determining the envelope of the same 9.75-GHz burst is to perform a Hilbert transform in
Matlab. Rather than using
demodulation as in the previous method, this approach uses in-line Matlab by applying the Matlab math operator directly to the RF carrier to produce the burst envelope. With Teledyne LeCroy's
LabMaster 10Zi-A oscilloscopes, you can apply this approach at frequencies from DC to 100 GHz in real time.
The actual code for the Hilbert transform is derived by performing the transform on the input waveform, extract the absolute value, and output that value back as a waveform for display on the oscilloscope. It can be done in four separate lines or in a single line of Matlab code (Figure 3). The Hilbert transform waveform updates live and in real time
 |
Figure 4: Determining an RF burst
envelope with three chained math
operators |
A third approach to determining an RF burst envelope is to use a combination of three math
operators: sparse, absolute value, and
ERES (enhanced resolution). As shown in Figure 4, with our 9.75-GHz RF burst as the input signal, F7 is set up as the sparse of the absolute value of the RF burst, and F8 is the ERES of that output, chaining three math operators together. The ERES in this example is set at 2 bits, so it's an FIR filter (Gaussian low pass). The sparse operator decimates the waveform at 500:1 to remove extra samples before filtering. This approach can also be applied at signal inputs of up to 100 GHz on an appropriate oscilloscope.
 |
Figure 5: The Parameter Track operator
shows how a measurement changes
over time |
The fourth method is to use the oscilloscope's
Parameter Track operator. This extremely useful analysis tool plots the results of any given measurement against time, giving you a very clear view of how a parameter changes when measured for a relatively long period. The example shown in Figure 5 is a track plot of the period of a waveform over nine cycles. The Track waveform has all of the properties of an acquired waveform; it can be saved, measured, and analyzed just as acquired waveforms.
 |
Figure 6: A Track plot of an RF bursts's
frequency@level measurement |
In Figure 6, we see an example of applying the Parameter Track operator to a frequency@level measurement on an RF burst. In the image, F7 is the Track plot of P2, which in turn is the frequency measurement of the RF signal. As the frequency drops in value during the electrical idle time between pulses, we see that the Track plot drops concurrently. Again, measurements may be taken on the Track plot. This approach, as with others, can be applied from DC up to 100 GHz in the case of the LabMaster 10Zi-A oscilloscope.
In upcoming posts, we'll look at some other measurements involving electronic-warfare applications, including RADAR analysis, frequency-domain measurements, and more. Stay tuned (yes, pun intended)!


No comments:
Post a Comment