 |
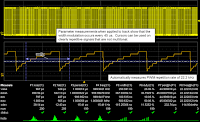
Figure 1: Persistence display provides
a quick-and-dirty view of a PWM signal |
Pulse-width modulation (PWM), a favorite technique for achieving analog ends through digital means, finds application in all kinds of end systems. Motor control might be the number-one application, but PWM turns up in telecommunications, audio systems and amplifiers, and any number of other uses. Armed with a capable oscilloscope, one can thoroughly analyze and understand the behavior of PWM circuits.
 |
Figure 2: A Parameter Track plot of
pulse width reveals the shape of
the PWM signal's modulation |
One quick-and-dirty way of getting a high-level picture of a PWM signal is by using your oscilloscope's
persistence display capabilities (Figure 1). Using persistence can give you a general idea of the kinds of pulse widths you're dealing with in your signal. Color grading shows you where most of the waveform activity is. However, persistence will not help answer the questions in the white box in Figure 1. For that, you need to use more insightful analysis techniques.
 |
Figure 3: Measurements on a Track plot
of the input signal's period@level provide
the frequency and period of the modulation |
An important tool is to use your oscilloscope's
Parameter Track operator. This extremely useful analysis tool plots the results of any given measurement against time, giving you a very clear view of how a parameter changes when measured for a relatively long period. For a PWM signal, generating a Track plot of pulse width shows how that parameter changes over time, with pulse width on the Y axis and time on the X axis. Figure 2 shows that the narrowest pulses occur the least often; pulses are subsequently wider and wider, with the largest pulses being the most frequent before the cycle repeats.
 |
Figure 4: Using the Track plot as a tool
for finding signal anomalies |
The Parameter Track plot is itself a waveform representing the PWM de-modulated waveform. In Figure 3, we use cursors to measure period@level of F1 (the Track plot) and find a 45-μs interval (P7) and a 22.2-kHz modulation rate (P8) on the PWM signal. The input signal has a 1-μs period and frequency of 999.99 kHz. Thus, we have discerned not only the frequency and period of the input signal, but also that of the modulation. Viewing that modulation shape in the Parameter Track plot provides a window into the PWM signal's shape.
 |
Figure 5: Using histograms to
dig into the waveform's duty cycle |
One may also use the Track plot as a tool for finding anomalies. In Figure 4, we can see that the pulses were wide. As soon as the pulses narrow, the track points directly at the location of the narrowest pulse.
Histograms can also be a useful tool in analyzing PWM signals. Figure 5 shows a histogram distribution of how many times each of the duty cycle values occurs. In this case, the histogram is of P6, which is the duty cycle of the input signal. It has a mean duty cycle of 36.7%. Cursors placed on the histogram bins show that 4.8% of widths fall into the range of 35.1% to 39.9% duty cycle.
 |
Figure 6: A Track plot of the input waveform's
period reveals whether it is being
modulated along with the pulse width |
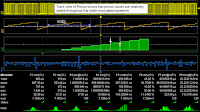
A Track plot of the period of the input waveform can tell us whether the period of the waveform is being modulated along with the pulse width (Figure 6). From the Track plot, we can see that the period is not being modulated, as it has a Gaussian white-noise shape reflecting random variation in the input waveform's period. In contrast, the pulse width displays a deterministic shape pattern.
After the foregoing measurement and analysis steps, one would have a much deeper understanding of what is really going on with a PWM signal.


No comments:
Post a Comment