 |
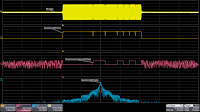
| Figure 1: An example of a radar signal with 1-GHz RF carrier |
First, we'll consider a radar pulse signal with an RF carrier frequency of 1 GHz (Figure 1). In this example, several math operators are in use. One is the demodulation of the input RF signal (math trace F1), which produces an envelope of the amplitude modulation on the input. Another math operator is demodulation applied to the zoom trace, seen as the pink math trace (F2) superimposed over zoom trace Z1. Trace Z1 shows a single RF pulse from the input waveform. Finally, at bottom of Figure 1 is a fast-Fourier transform (FFT) of the zoom trace (F3 in blue), showing an isolated view of the frequency content of this pulse.
 |
| Figure 2: This Barker-coded radar signal uses phase modulation rather than amplitude modulation |
Another example of a radar signal is a Barker-coded, phase-modulated waveform (Figure 2). It is similar in shape to the previous example of an AM radar signal, but in this case, we use the demodulation math operator to derive the envelope of a phase-modulated signal. The demodulated envelope clearly shows the Barker encoding. At bottom, the blue F3 FFT trace displays the signal's frequency spectrum.
A final example is of a radar signal with linear frequency-modulation chirp (Figure 3). The demodulated RF envelope (trace F1) reveals the chirp in the signal, indicating that frequency is being modulated throughout the pulse. The frequency rises in a linear ramp. In this case, the demodulation is from the frequency perspective to extract the modulation shape. The frequency demodulation (trace F2 in pink) shows frequency as a function of time, while the FFT (trace F3 in blue) shows frequency vs. magnitude.
Hopefully, we've shown the usefulness of your oscilloscope's demodulation math function with regard to examination of radar signals. We will delve into other facets of electronic warfare-related RF measurements in future posts.

1 comment:
Spot up with this write-up, I truly think this website requirements a lot more consideration. I’ll oftimes be again to read additional, thank you that info. Stefan Magic
Post a Comment